
- Features
- Statistics
Restaurant statistics
Analyze reports, metrics, and charts in a single dashboard with Risto Pilot 📊
If you run a restaurant, you already know that “going by gut feeling” is expensive: an understaffed shift, a dining room full at the wrong time, or a slow day you could fill empty time slots with a targeted campaign (see Customer Management & Marketing). With Risto Pilot’s restaurant analytics, you have clear statistics and reports that can be consulted in just a few clicks, directly from the app.
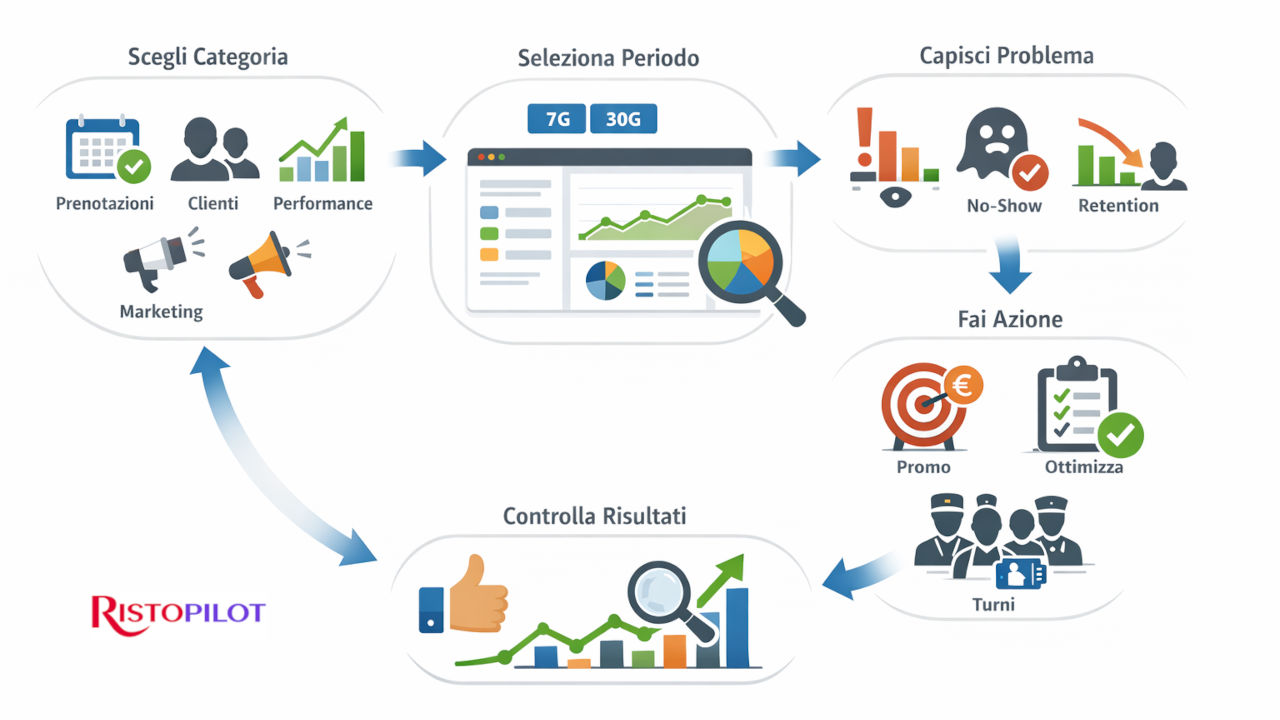
The logic is simple: choose the metric (Reservations, Customers, Performance, Marketing), select the subcategory, and set the time period. In return, you get charts and figures that are immediately easy to read, useful for deciding what to do today and what to improve tomorrow. ✅
Practical goal: turn “scattered” data (for example Reservations, customers, cash register, and marketing) into a measurable restaurant performance trend: understand what works, what needs fixing, and where to intervene to increase covers, efficiency, and margin (without complicating your life). 🙂 If the goal is to increase margin, also connect purchases and waste with Smart Shopping List.
Restaurant statistics: why looking at the numbers helps you work better (and with less stress) 🧠
Restaurant statistics are not there to “do accounting.” They are there to answer operational questions, the ones that really matter:
- When is it worth pushing a promo? (slower days and time slots)
- Where am I losing covers? (no-shows, cancellations, overbooking, non-optimized slots)
- Which customers are coming back? (real loyalty, not just “impressions”)
- Is the service running smoothly? (average times, table turnover, peak hours)
- Are campaigns working? (sending, reads, results, coupons, and returns)
In Risto Pilot, restaurant statistics analysis is designed to be read quickly: fewer “consultant-style” charts, more indicators that are useful for making practical decisions for tables and dining rooms, in the kitchen and at the cash register (and to connect sales and revenue coming from Orders and Cash Register).
Restaurant statistics
Clearly see what has happened over time so you can make informed and productive decisions.
Restaurant statistics on Reservations: trends, no-shows, time slots, and sources 📅
The reservations section helps you read the flow clearly. Not just “how many reservations,” but how they arrive, when they arrive, and what quality they have. This way you can set smarter rules and reduce gaps and unmanageable peaks.
What you look at (in practice): reservation trends, reservations by status, last month’s no-shows, reservations by time slot and weekday, average pax, cancellation rate, booking sources.
The advantage is that you start reasoning by slots and channels: if a time slot is always “dead,” it is not bad luck... it is a signal. If one source brings more reliable reservations, you can push it more. And if no-shows increase, you can intervene before it becomes a habit.
Restaurant performance trend for Customers: return visits, frequency, retention, and lifetime value 👥
Customers are not “all the same.” Some come back, some disappear, and some become promoters of your venue. Here, restaurant analytics shows you the difference with simple numbers: who is new, who is returning, who comes often, and who needs to be reactivated.
What you find: new vs returning, top customers, visit frequency, customers by area, retention, loyalty program members, and customer lifetime value.
This is gold for marketing, but also for service: if you understand who your best customers are, you can build a more consistent experience (and far more relevant campaigns). And when retention drops, you see it immediately: not when the “empty” week arrives. 📉
Restaurant statistics analysis on Performance: occupancy, dwell time, turnover, and peak hours ⚡️
Here you get into the operational core: how well you are using the space, how long a table stays occupied on average, where bottlenecks occur, and which moments really generate volume. If the restaurant is an organism, this is its diagnostics.
What you look at: daily revenue, occupancy rate, average dwell time, peak hours, table turnover, service efficiency.
A concrete example: average dwell time and table turnover are not there to “rush” the customer. They are there to better predict timings, give realistic waiting times, and manage reservations and service without stress. And occupancy helps you understand whether you are leaving covers on the table (or if you are running too close to the limit). 🍽️
Statistics and Reports on Marketing: measure campaigns, reads, and results (without relying on intuition) 💌
Running campaigns “at random” is like changing the menu without tasting it: sooner or later, you pay for it. With restaurant statistics on marketing, you can read what is really happening: how many people you reach, how many open, how many respond, and which messages bring more return visits.
In practice: you compare campaigns, understand which communications perform better, and improve over time with small adjustments (audience, copy, timing, coupon).
And the best part is that everything remains tracked: you do not have to reconstruct information across Excel sheets, chats, and different apps. Your restaurant performance trend becomes a readable story, not a puzzle. 🧩
Restaurant analytics: how to use statistics in 10 minutes a week (really) ⏱️
- Open “Restaurant Statistics” and select the metric (Reservations / Customers / Performance / Marketing).
- Set the time period (last week or last 30 days) and look at trends + peaks.
- Identify 1 problem (for example, a weak time slot, rising no-shows, falling retention).
- Take 1 action (slot rules, targeted campaign, shift optimization, promo on a weak day).
- Check again the following week: if it improves, you see it. If it does not, you change course without wasting months.
This is the point: statistics and reports are not “one more thing.” They become a lightweight habit that gives you more time, control, and peace of mind. 😄
Related Modules 🔗
Statistics become truly useful when you connect them to the modules that generate the data: sales, reservations, marketing, purchases, and tax management. This way you move from “looking at numbers” to understanding what to do tomorrow (and what to stop doing today). 📈
✅ Want to see your restaurant’s Statistics in action?
Try Risto Pilot with a guided demo: we will show you how to read trends, performance, and marketing in a single dashboard and how to turn numbers into practical choices.
A tip from one restaurateur to another: if you want to test the suite, do it now. The available trial versions are limited and are assigned on a first-come, first-served basis.